Stacks
JavaScriptD3JS
Description
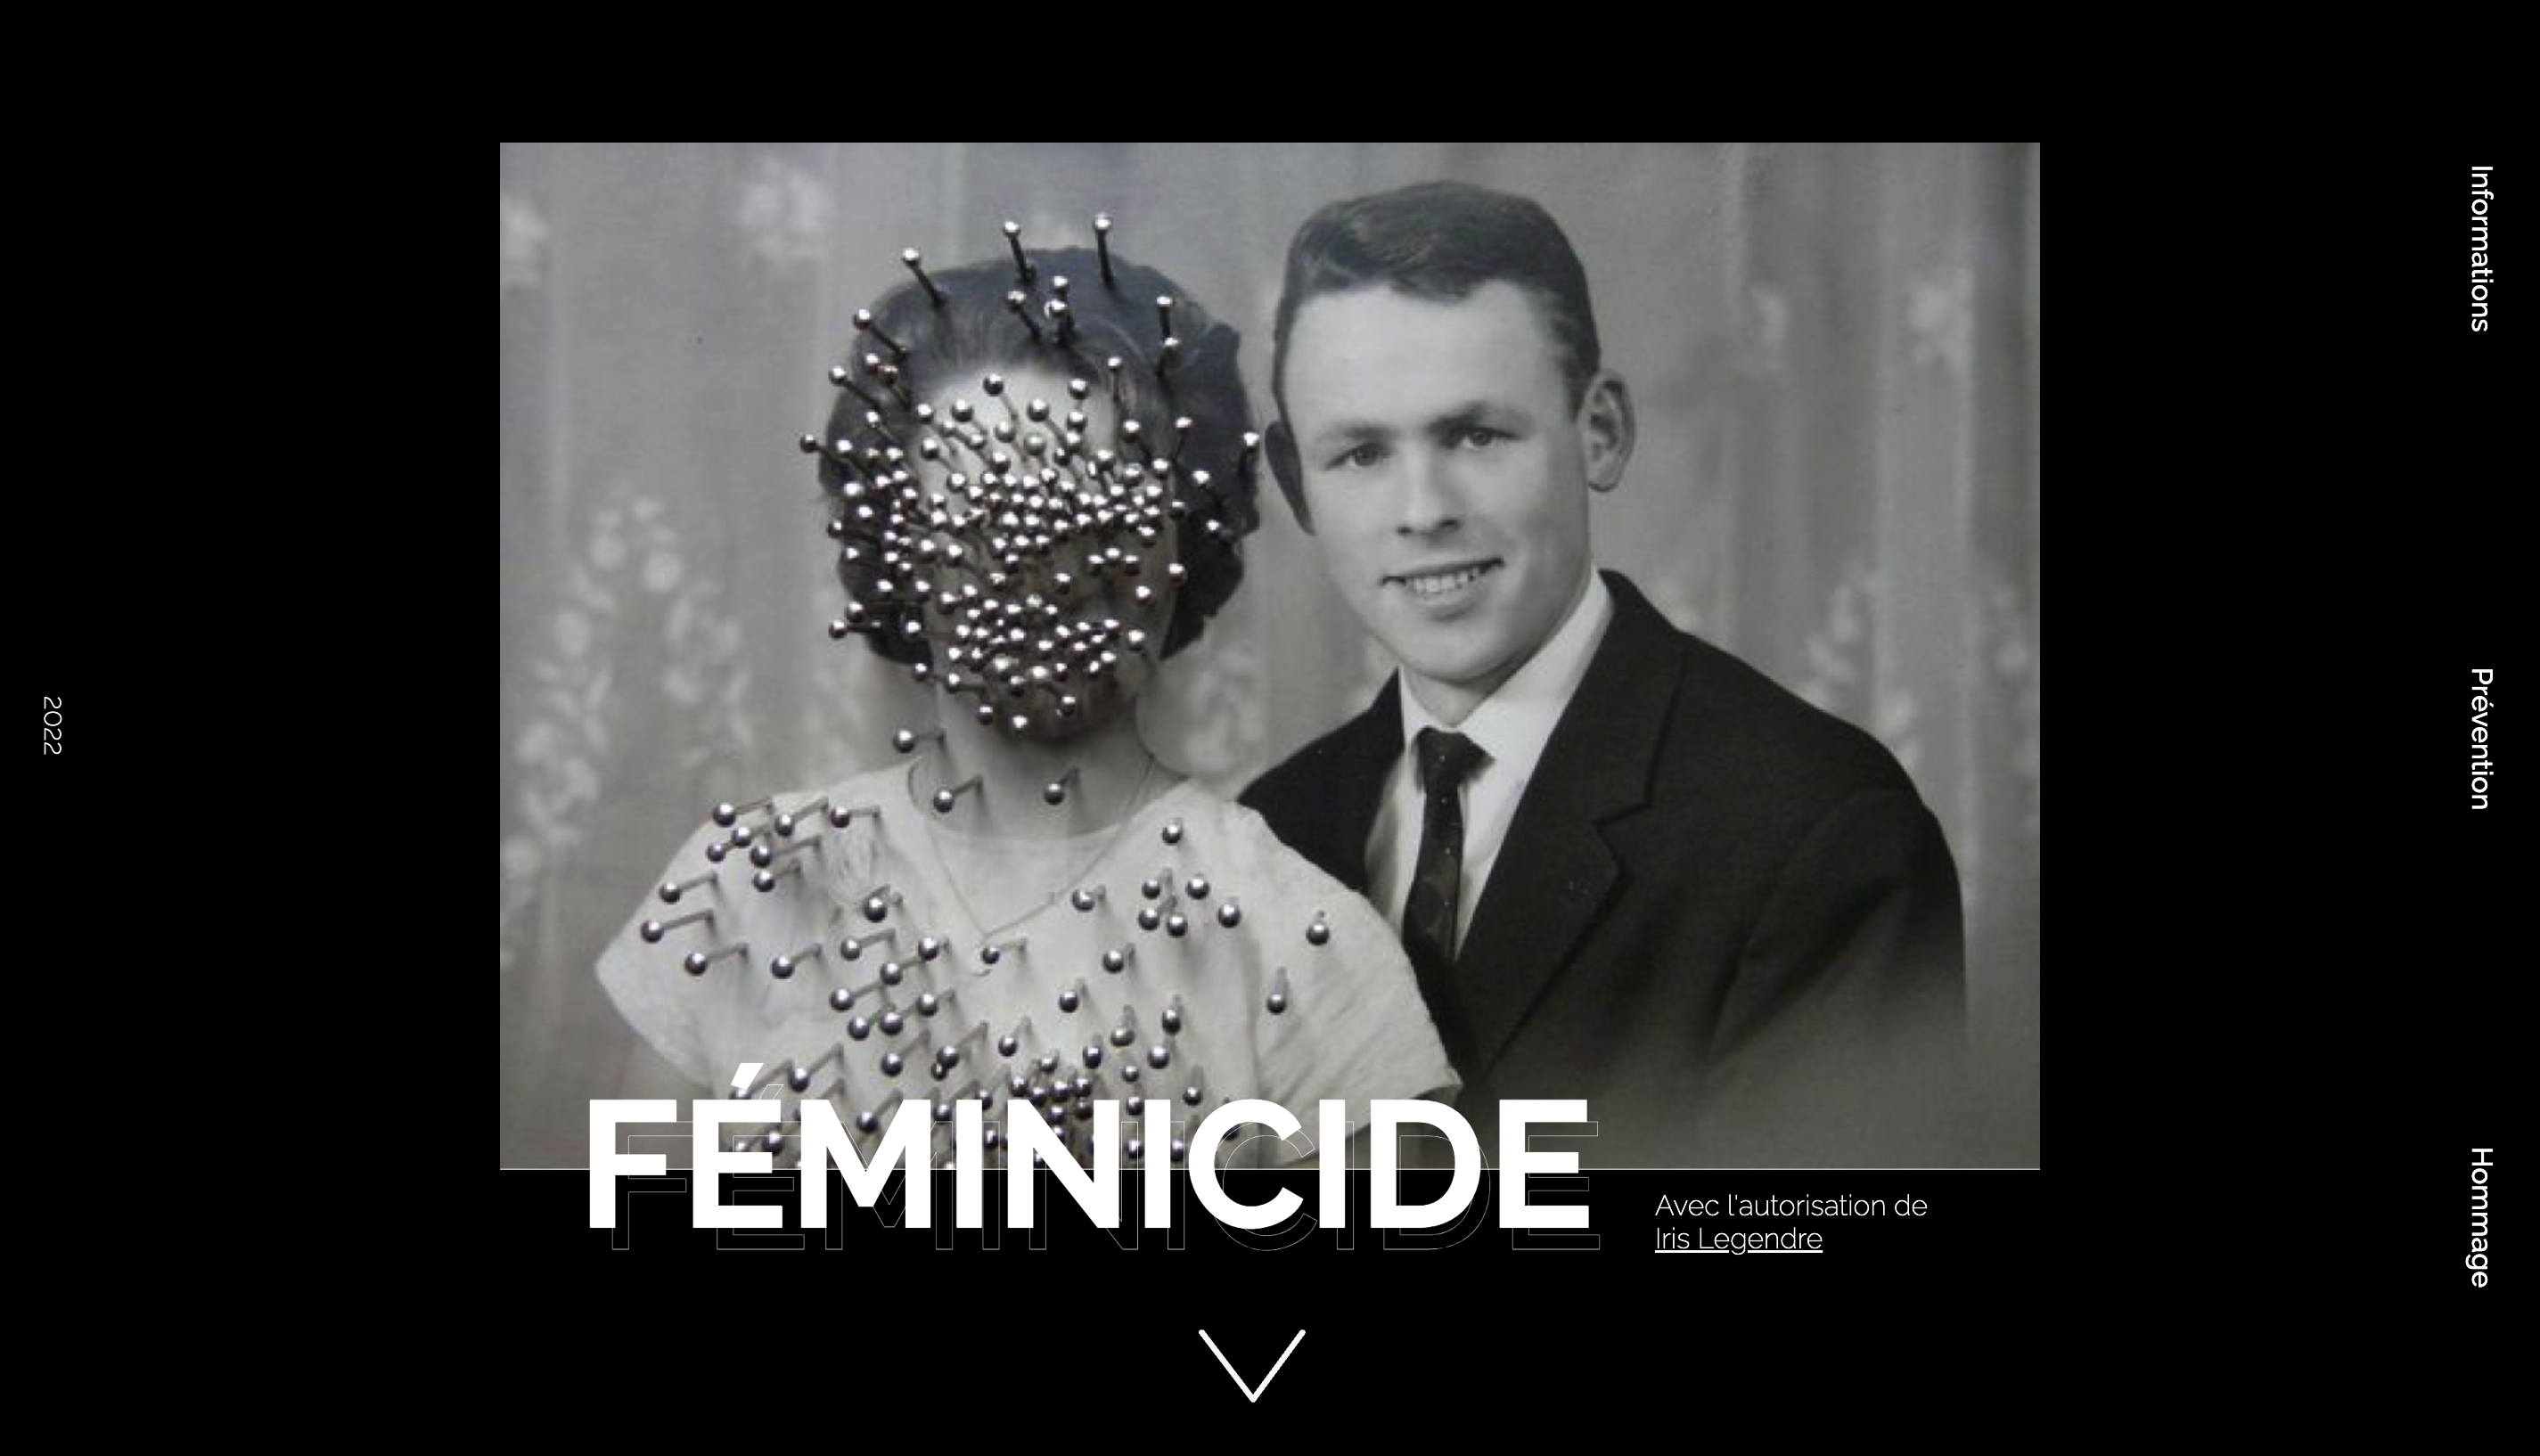
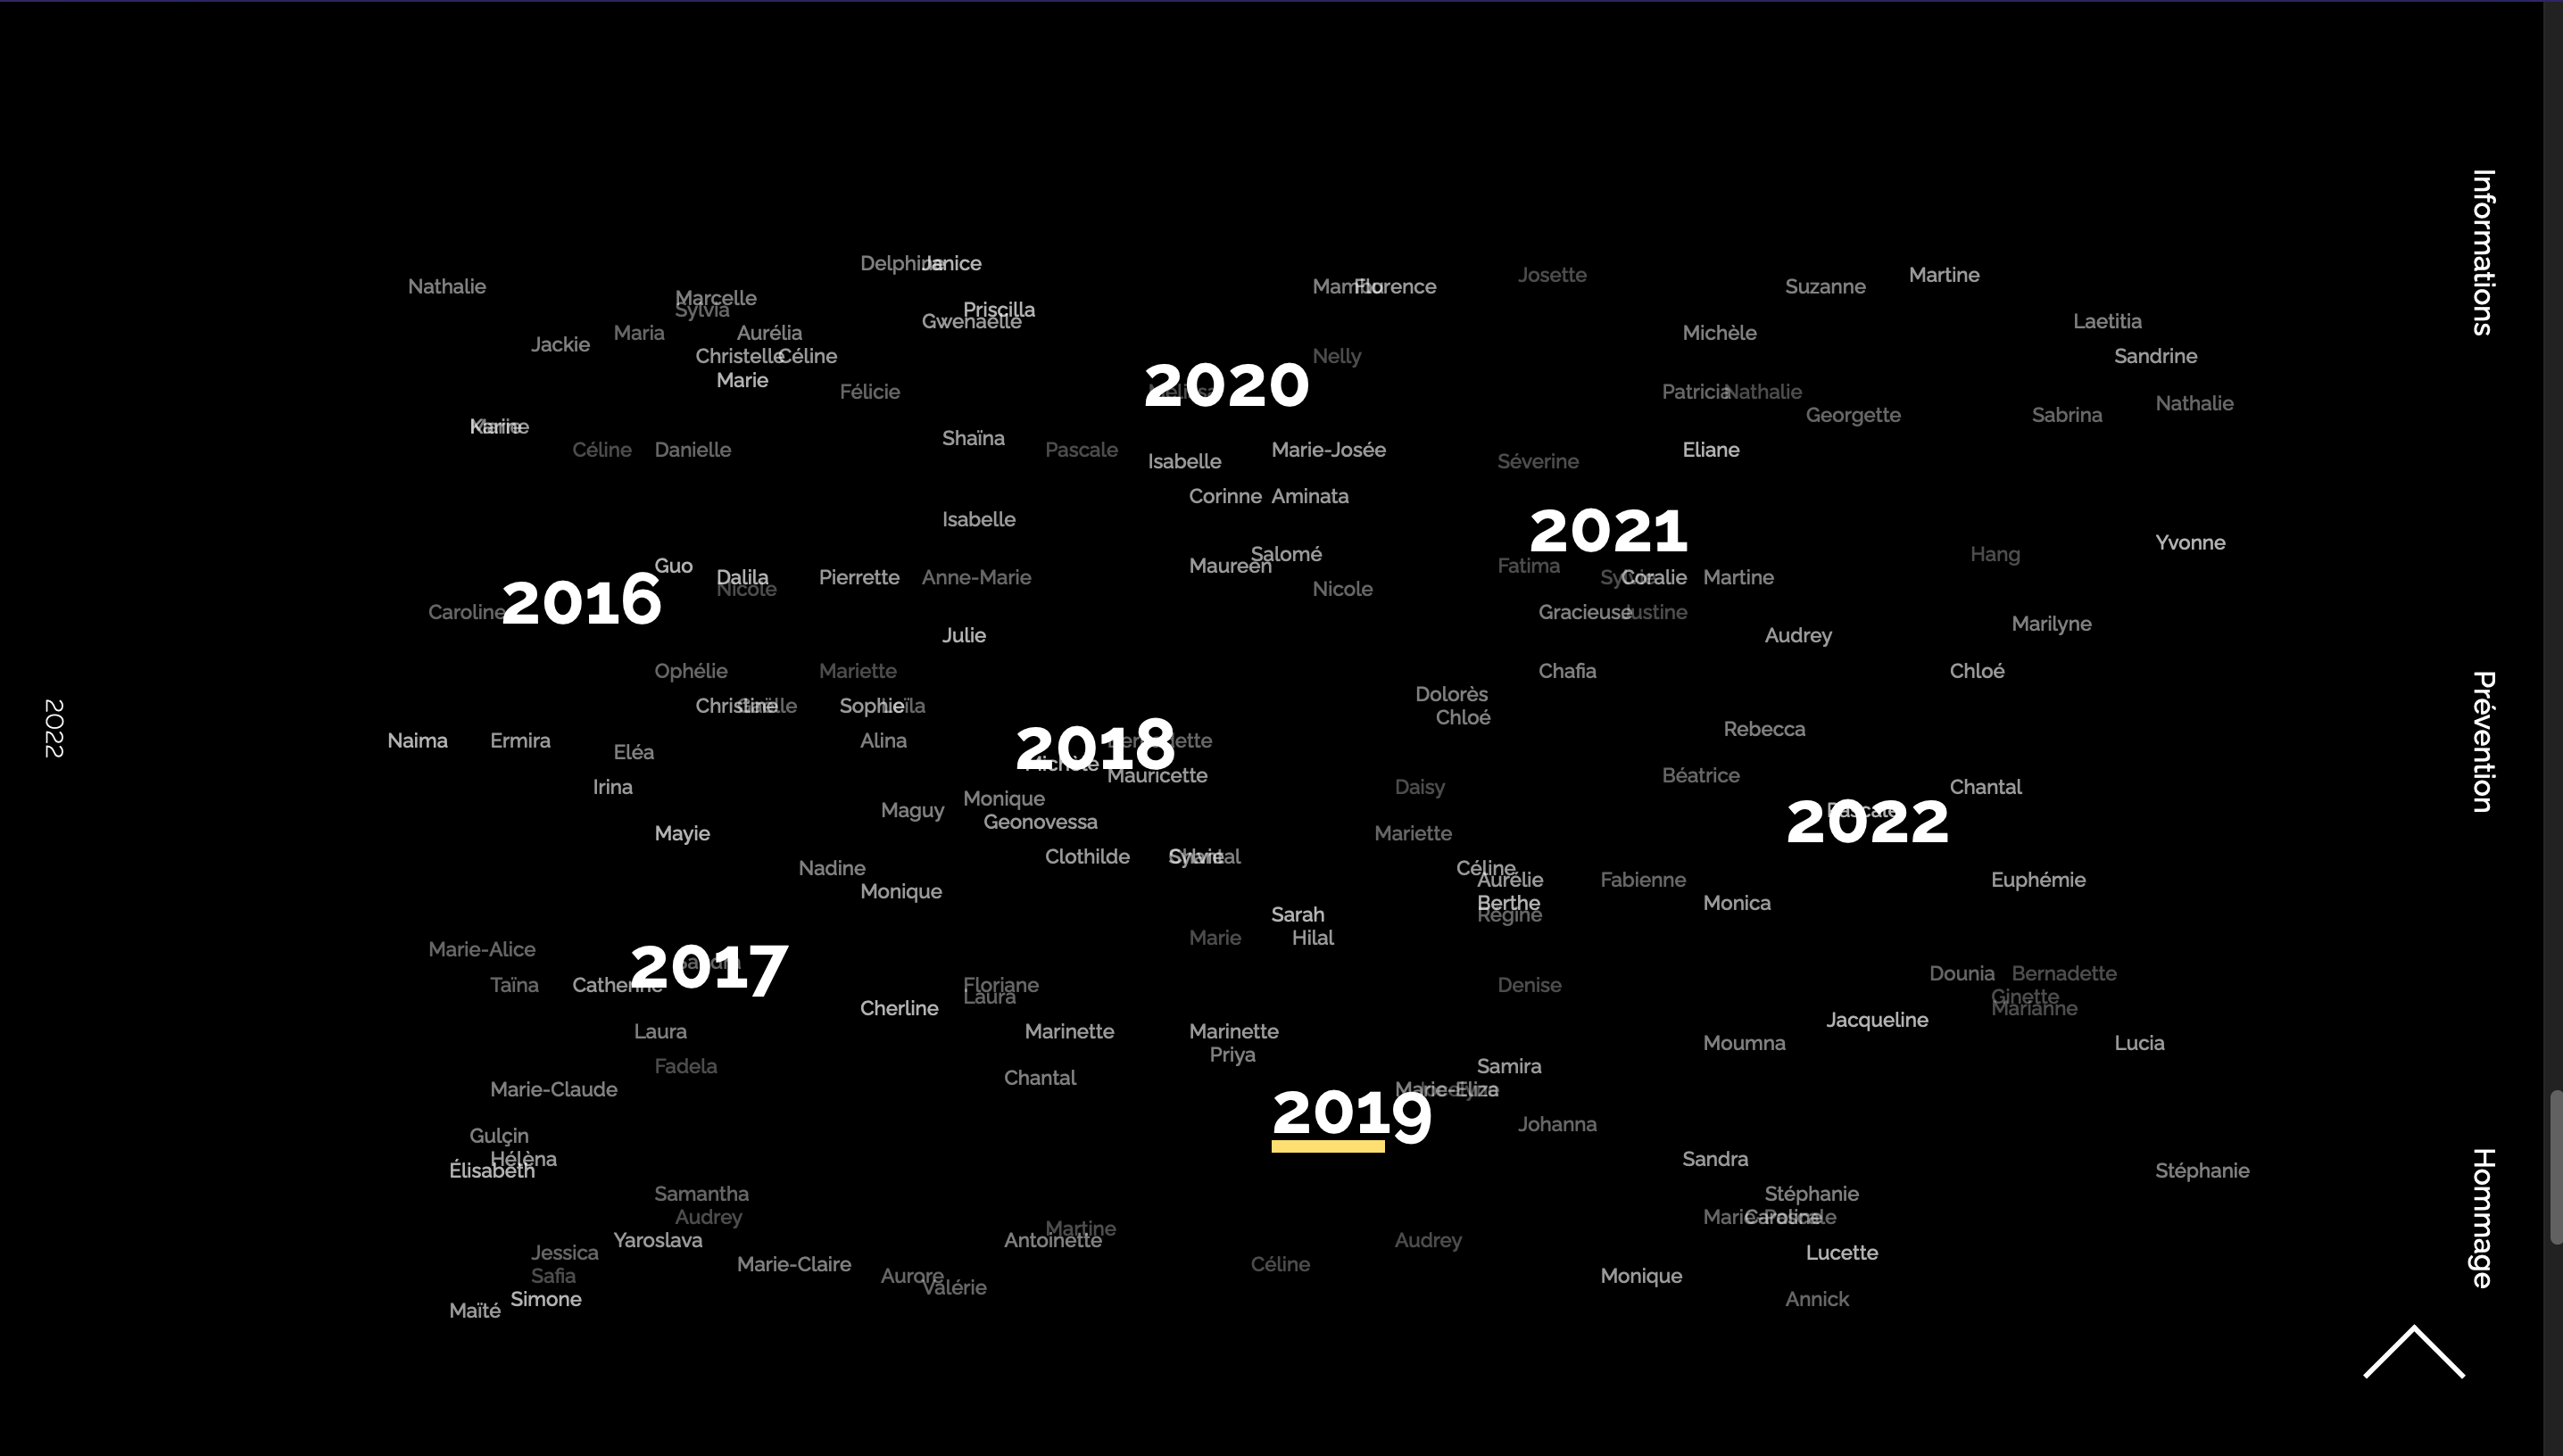
At the beginning of my second year of MMI, we were asked to create a data visualization website on a theme of our choice. For this project, I was accompanied by Clara Many and Pagnarith Kok Srey. We chose to address the theme of femicides because we believe it is still too little highlighted despite its importance in society. To populate our site, we retrieved data from the feminicides.fr website, which lists the number of femicides per year since 2016. This impactful project was presented on the Gustave Eiffel University website for the Day against Violence towards Women. It was also mentioned on the list of committed student projects proposed by the Gustave Eiffel University website.
My work
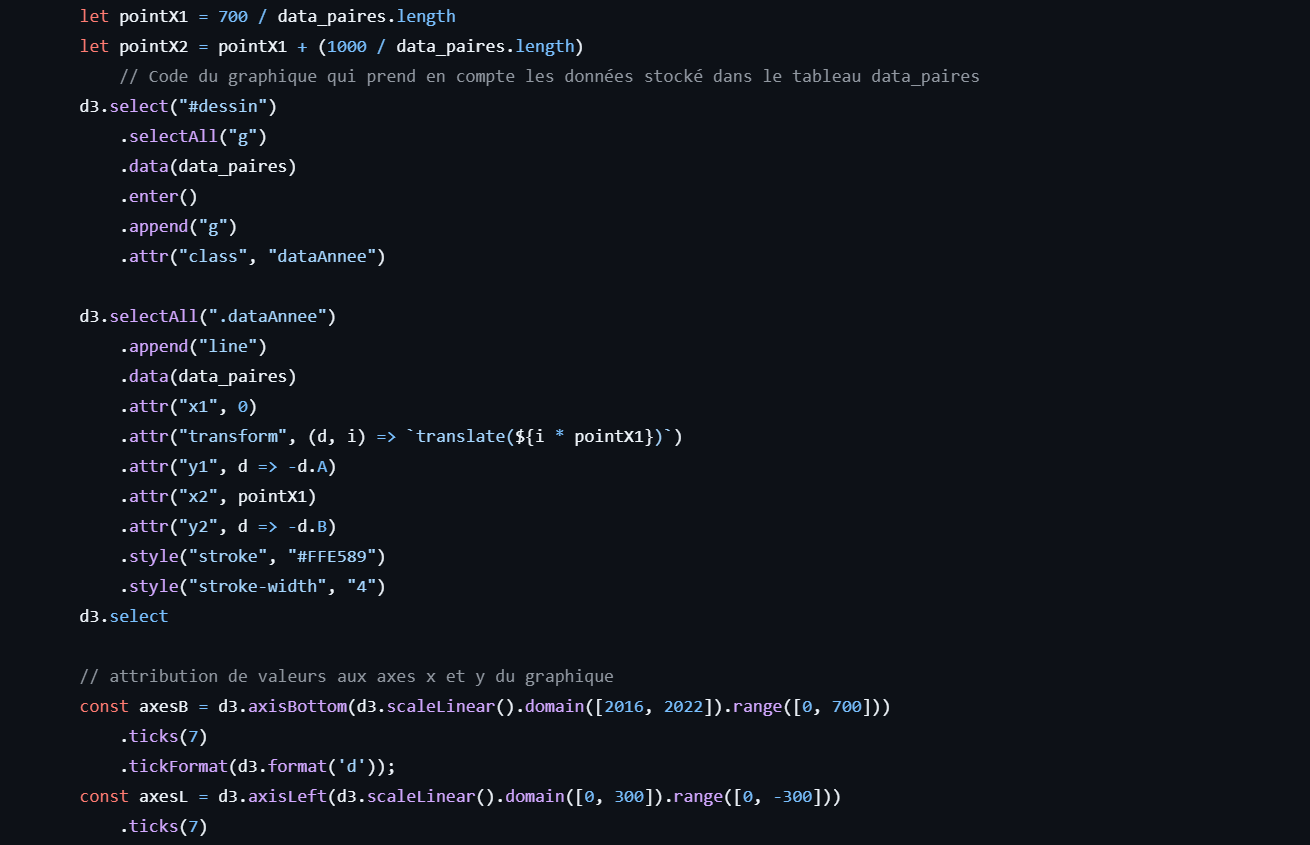
SVG Generation
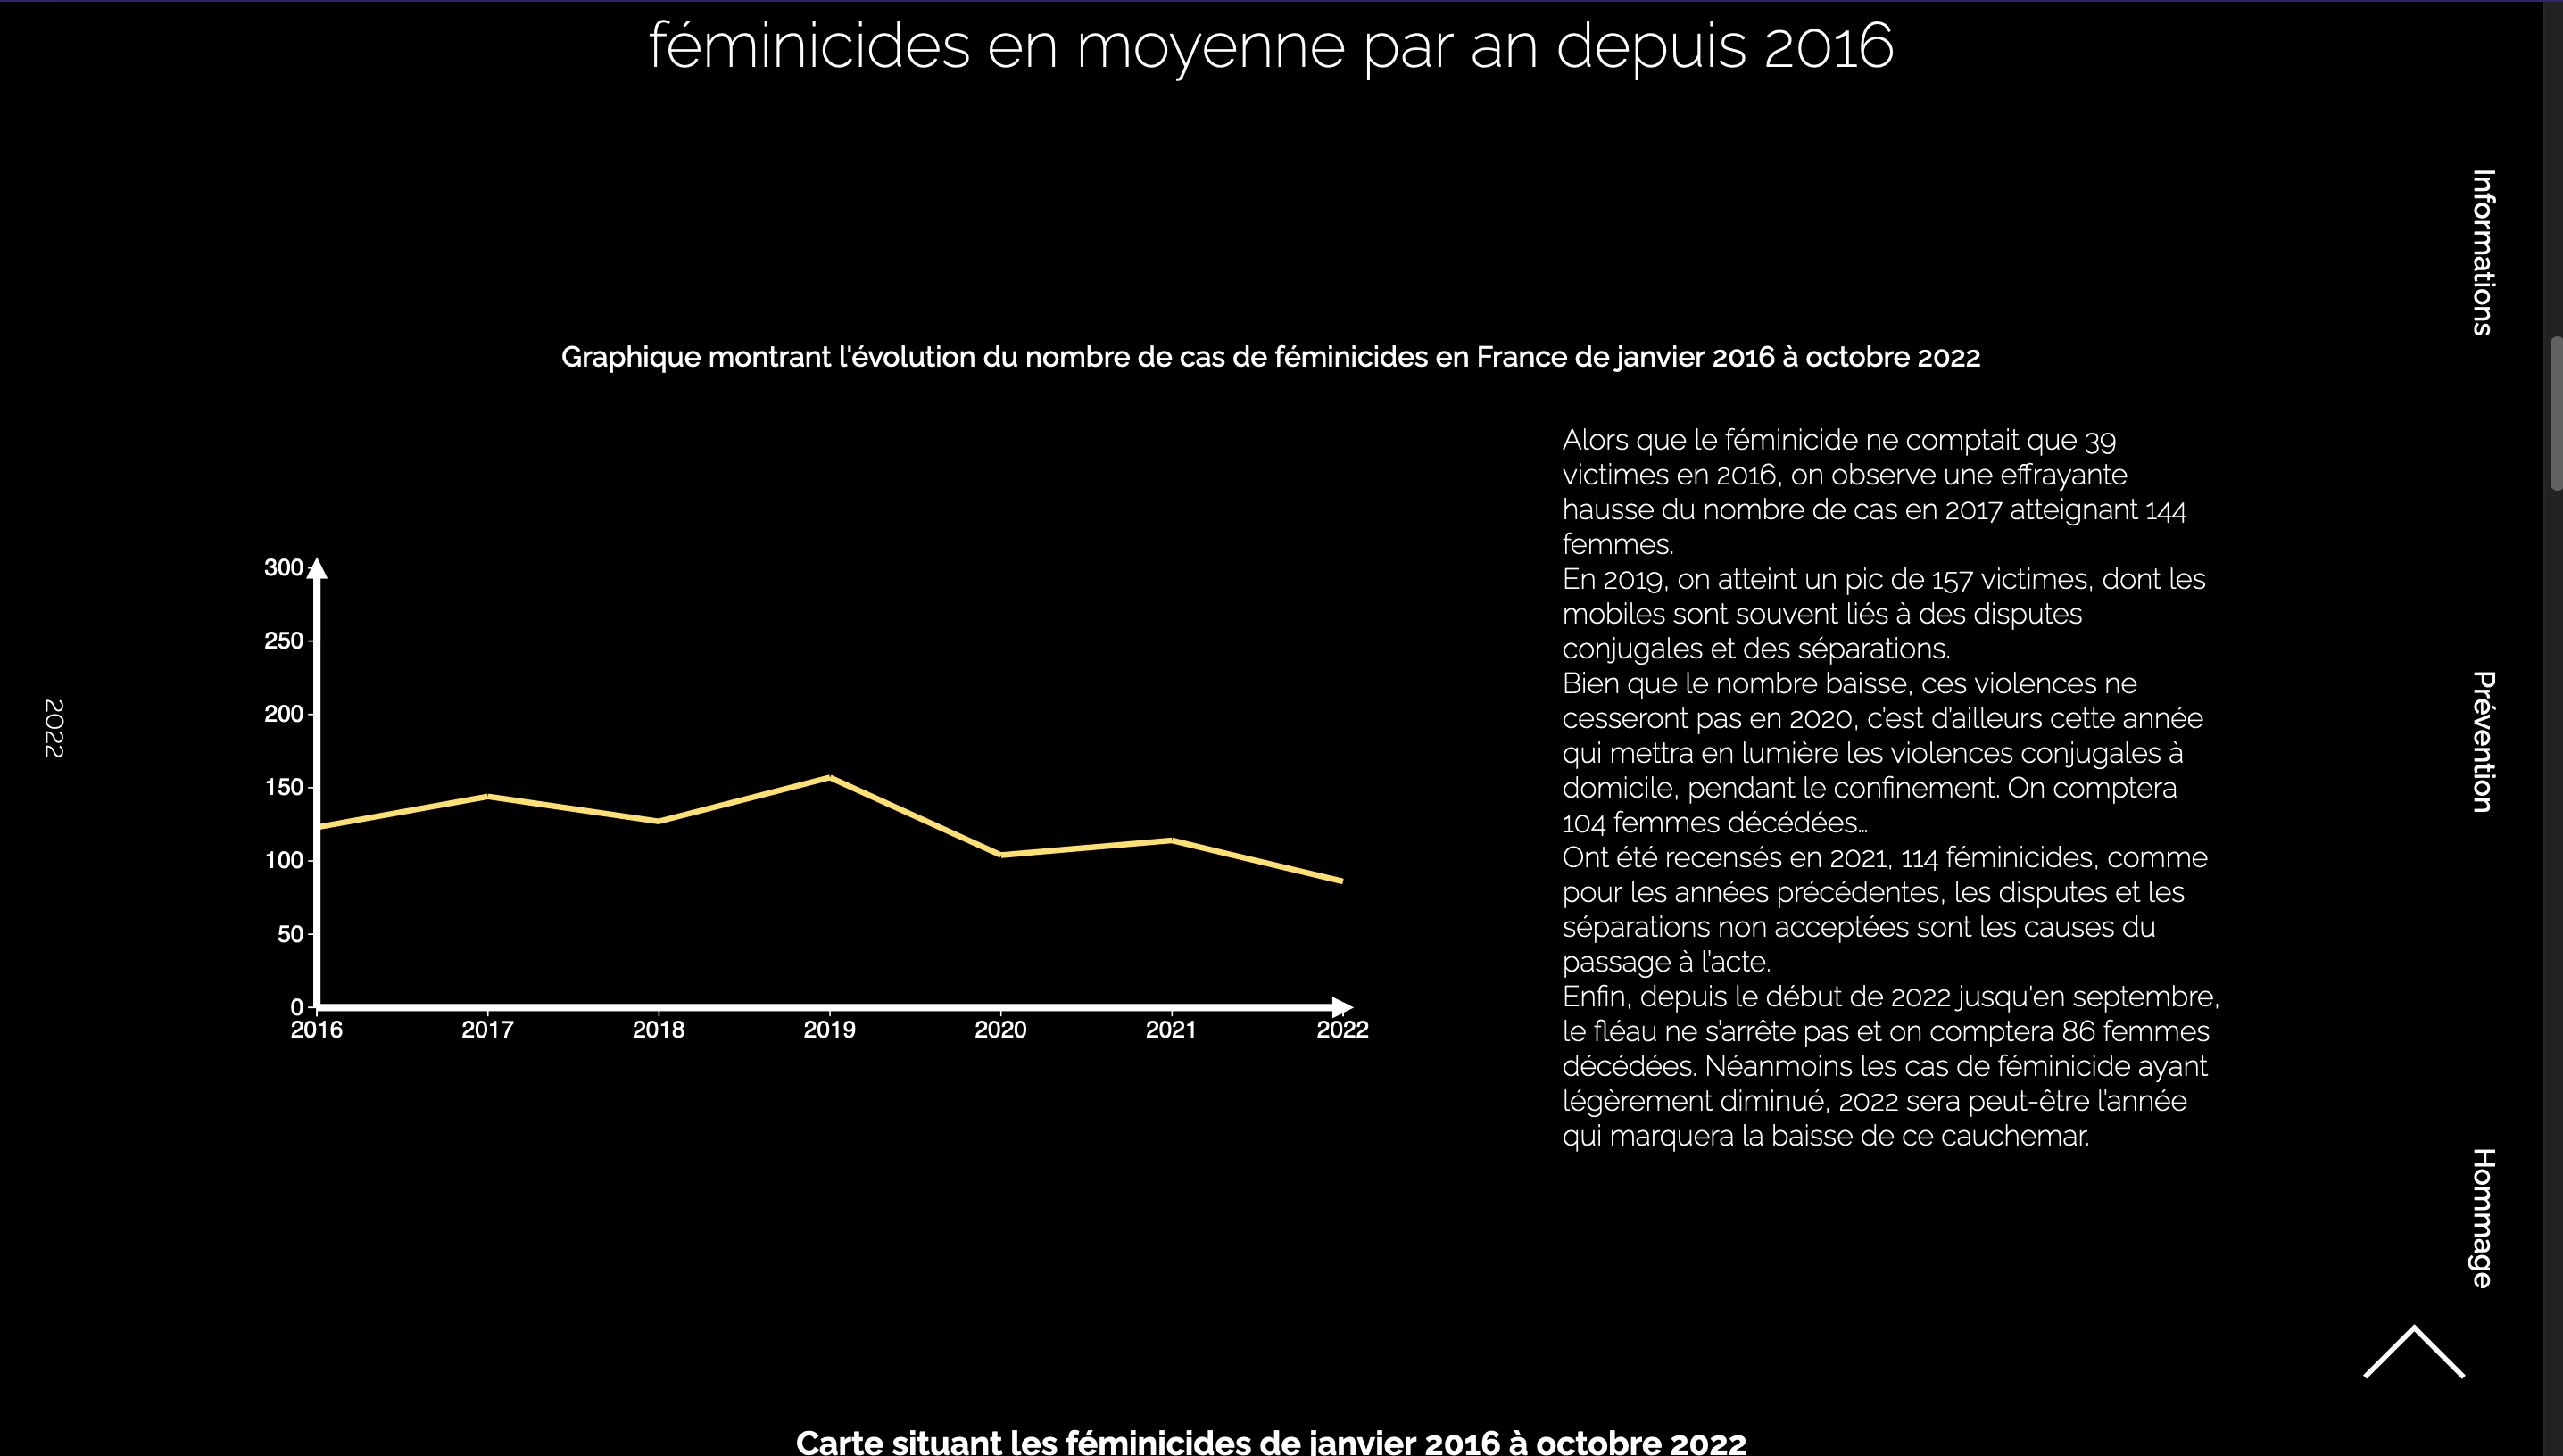
This project aimed to create data visualizations, so we used the JavaScript library D3JS to generate SVG content directly from the script; one of its uses in our case was generating a chart entirely based on JSON data we retrieved from the website feminicides.fr; I used this data to create a graph showing the evolution of the number of femicides between 2016 and 2022.